
System information

310
Switched Observer
Each switch being monitored will require a setup in the Switch Dashboard Dialog. This
dialog can be displayed by selecting
Tools > Switch Setup Dashboard.
Important Note: Each change made in this dialog must be followed by
selecting the Stop button and then selecting the (R
E)CONNECT AND
E
NABLE SWITCH MANAGEMENT icon.
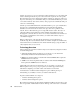
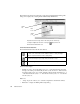
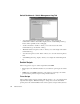
Switch Dashboard Button Bar
The Switch Dashboard button bar has three buttons:
Window header display:
• Number of cycles—shows the number of “loops” or cycles that the Probe has made
through your switch ports. Statistically, the more cycles, the closer to 100% accuracy
the displays will provide. A good rule of thumb would be that the information is + or
– 20% after the first 29 cycles, + or – 10% after the next 29 cycles, + or – 5% after the
next 29 cycles, etc.
Edit boxes:
• “Script” dropdown—allows you to select the script file the current Probe will use.
• Edit button—displays the Editing Telnet Script dialog.
(Re)Connect and Enable Switch Management—this connects (or reconnects
the Probe to the switch defined in the “Switch IP Address” setting, and begins
whatever script is defined in the Probe settings dialog.
Disconnect and pause switch management—this causes the Probe to
disconnect and stops the processing of the current Probe’s script.
Clear switch log—clears the “Switch Telnet Communications Log.”
Button
bar
Edit
boxes
Switch
ports