
System information

302
Real-Time Expert
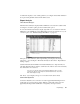
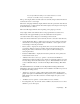
Server Characteristics:
• “Server type” dropdown—options include Database, Ftp, Level, and Web servers.
Each different server selection causes the expert to use a different formula suited for
the selection. A level server offers a formula for a typical server.
• “Start thread time (ms)” spinbox—taken into account when the “Server type” item is
defined as “Web.” The value is the amount of time it take to process a thread on the
server.
• “Arrival rate (trans/sec)” spinbox—taken into account when the “Server type” item is
defined as “Database.” The number of transactions per second that are being
requested of the (Database) server.
• “Maximum adapter cCard throughput (Mbps)” spinbox—taken into account when the
“Server type” item is defined as “Ftp.” This item defines the server’s maximum
throughput. This may be the rated speed of the adapter, but most likely it is some
fraction of the maximum theoretical speed (utilization) of the network. The default of
this item is set in the Expert Global Settings, under the What-If tab.
One way to get a value for this option is to run Observer on the server using
the packet generation mode. Set the generation rate very high and view the
utilization that the server can create using Observer’s utilization modes. The
maximum utilization will reflect the NIC card’s ability to generate traffic.
• Restore Original Values button—resets all values to the initial settings for the
analyzed pair.
• Set Reference button—sets the current graph lines to the reference line. For example,
if you change the number of simultaneous users from 1 to 100, a What-If prediction
line will be displayed and the original reference line will be displayed. If the “Set
Reference” button is pressed, the new What-If prediction line will become the
reference line for further What-If modeling.
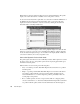
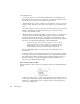
What-If Analysis Right-Click Menu
The right-click menu offers a number of configuration selections in the What-If Analysis
display.
• Y-Axis—selects the values to be shown on the Y-axis. This is an alternative method
of selecting the “Graph Type.” Options include Packets/sec, Response time (sec), and
Utilization (%). While all three views are related, select the view that displays the
option you are interested in.