
System information

Expert Displays
301
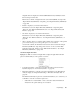
You can only do What-If modeling on conversations that have a recorded
server (the second address in any conversation) delay.
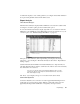
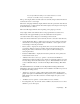
The top of the display will show which stations are currently being modeled. The client is
on the left, the server is on the right.
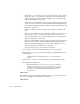
The X-axis of the graph will always display different network speeds. If the data collected
was from Observer, a vertical reference line will be displayed showing the network speed
at which the data was collected.
The Y-axis will display different values depending on the graph type selected.
A key display will show the different items on the graph and their associated colors.
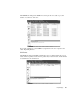
The items below the graph initially represent the actual data from the captured
conversation. Items can be changed to model changes in the network.
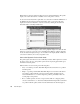
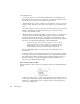
Observed Connection Parameters (derived directly from the conversation data collected):
• Average Packet Size (Bytes)—displays the average size of the packets sent from the
client and the server. Changing these values in the Client or Server spinboxes will
model changes in network performance.
• Latency (mSec)—displays the average latency time as observed in the transaction
conversation. Values are shown for packets sent from the client and the server.
Changing these values in the Client or Server spinboxes will model changes in
network performance.
• Transaction Packet Ratio—displays the transaction packet ratio of the packets sent
from the client and the server.
• “Utilization from other sources (%)” spinbox—sets the network utilization to
simulate. This would be in addition to the current conversational conditions recorded,
and only changes the modeled values if the option to “Include utilization from other
sources in What-If Analysis” is checked in the Expert Global Settings, What-If tab
setup.
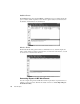
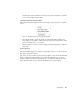
User-Defined Parameters are initially set in the Expert Global Settings, What-If tab.
Changing the values here will only affect the current calculation and will not be preserved
for subsequent modeling sessions.
• “Graph type” dropdown—changes what modeling results will be displayed in the
graphic view. Options include Packets/sec, Response time (sec), and Utilization (%).
While all three views are related, select the view that displays the option you are
interested in.
• “Simultaneous users” spinbox—sets the number of users to simulate.
• Processing Time (ms)—the amount of time, in milliseconds, that the server or client
will take to process the request.