
System information

Expert Displays
293
marginal values are displayed for Internet/WAN data that may naturally be slower
than local response time data.
Each level, for critical or marginal and for Local or Internet/WAN, are setup in the
“Expert Threshold (OSI Model)” setup dialog. See “Expert Thresholds (OSI Model)”
on page 270.
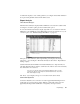
• Retrans—displays by conversation and direction.
Thresholds are set in the “Expert Threshold (OSI Model)” setup dialog under
“Transport” and “TCP Overall Retransmissions.” See “Expert Thresholds (OSI
Model)” on page 270.
• Zero Wnd—displays by conversation and direction.
Thresholds are set in the “Expert Threshold (OSI Model)” setup dialog under
“Transport” and “TCP Zero Window.” See “Expert Thresholds (OSI Model)” on
page 270.
• Other—displays other error conditions. These include slow connection on the specific
protocol and slow response on the specific protocol or conversation.
As with other columns, the thresholds for these items can be found in the “Expert
Threshold (OSI Model)” setup dialog under “Session” for most common TCP
applications and under “Transport” and “TCP Overall Conditions.” See “Expert
Thresholds (OSI Model)” on page 270.
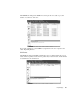
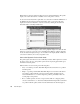
TCP Events Right-Click Menu
Highlight any TCP conversation and right click to display the right click menu with
options for further analysis on the specific conversion.
• Connection Dynamics—sends the conversation information to the Connection
Dynamics display. See “Connection Dynamics” on page 297.
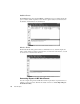
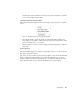
• Time Interval Analysis—sends the conversation information to the Time Interval
Analysis display. See “Expert Global Settings – Time Interval Analysis Tab” on
page 287.
The Time Interval Analysis option has a sub-menu that allows you to select how you
would like to view the conversation. Options are:
• Station1/Port <-> Station2/Port—sends conversation data to Time Interval
Analysis for the specific station/port conversation.