
System information


292
Real-Time Expert
Analysis is offered for both client and server.
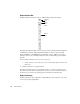
TCP Events Row Definitions
Station Columns:
• First “Station/Port->” column—displays the client in any conversation.
• Second “<-Station/Port” column—displays the server in any conversation, if it can be
identified.
Station column ports are displayed based on the setting chosen in the “Expert Global
Settings.” See “Expert Global Settings” on page 283.
By default, conversations will be identified by server port and application.
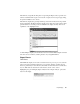
• Protocol—application protocols are displayed, if known. If the port used is unknown
to Observer, this column will be blank.
• Status—displayed as red, yellow, or green.
• Red—indicates a critical problem.
• Yellow—indicates a marginal problem.
• Green—indicates no problems.
Settings for critical and marginal are set in the “Expert Threshold (OSI Model)” setup
dialog. See “Expert Thresholds (OSI Model)” on page 270.
• Packets—displays the number of packets seen in each direction.
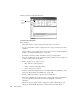
• Delay (ms)—calculates in each direction as an overall average of the delay within the
protocol. Only delay between data sent and acknowledgment is used for the
calculation.
Whether the delay is judged critical or marginal is considered differently for local
data and for Internet/WAN data. This is to make certain that no false critical or
TCP
events
row