
System information


270
Real-Time Expert
identification. Should a particular packet require further investigation, its decode is
only a click away.
• Server Analysis—displays a server/device's characteristics and response times
charted against the number of simultaneous requests asked of that device. Response
times are charted for recorded request sets and plotted for predicted response times as
request loads increase.
• “What If” Modeling analysis—starts with measurements based on actual client/server
conversations or peer-to-peer conversations, and plots possible response time,
utilization, and packet flow scenarios. This allows you to predict network bandwidth
and response-time impact for topology changes (e.g., 10MB to 100MB) or by
changes in variables such as average packet size, send-to-receive packet ratio, latency,
server load, and number of users.
This “live-modeling” lets you assess the impact of possible network or
application changes.
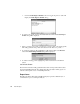
Getting Started with Expert Analysis
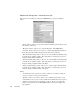
To display Expert Analysis, select the Decode button from the Packet Capture window
and click the Expert Analysis tab.
Configuring Real-Time Expert
Configuring the Expert system is a two-step process. While it is recommended that all
Expert users familiarize themselves with both configuration areas, the Expert system is
quite functional for most LANs without any modification of the default configurations.
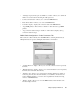
The two Expert configuration areas are the Expert Item Thresholds and each Expert
mode’s General Settings.
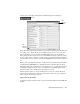
Expert Thresholds (OSI Model)
To display the Expert Thresholds (OSI Model) configuration display, select Mode
Commands > Expert Thresholds (OSI Model)
while the Expert window is displayed.
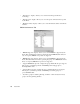
Expert Analysis tab