
System information


269
Real-Time Expert
Overview
Real-Time Expert incorporates all of the features of Observer and adds Observer’s Expert
system to help identify problems and help determine the best course of action. With Real-
Time Expert you can get real-time post capture expert event identification, expert analysis,
and modeling of network traffic data.
Real-Time Expert has multiple views to help identify different network problems.
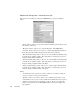
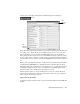
• Expert Summary problem analysis—shows all error events in a single, concise
display. For connection-oriented problems, a simple double-click drills down to
further analysis.
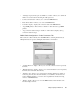
• TCP/UDP/ICMP Events—displays protocol-based and application-based problems.
Local traffic is judged using different criteria than WAN/Internet traffic to help make
certain no false readings are provided. All common port-based services are tracked
and slow response/no response and slow connect/no connect are flagged and sorted by
severity. A generic TCP condition expert tracks all port-based protocols for slow
response or connect characteristics.
• IPX Events—displays all communication errors being transferred via Novell.
• NetBIOS Events—displays the number of NetBIOS conditions and events that are
being transferred over the network.
• Expert Wireless Events—tracks network conditions between wireless stations and
logs a number of events of interest to a wireless network administrator, including the
type of error, the sending and receiving stations, and other status information. As with
other expert events, detailed explanations are just a click away in Expert Help.
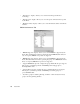
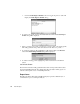
• Time Interval Analysis of any conversation—can be displayed as a “drill-down” from
any problem identified in the IP/TCP/UDP Experts. Time Interval Analysis shows
network errors organized by time periods to identify whether a problem is sporadic or
consistent throughout the day. This information is critical in determining if a problem
is spread throughout a period of hours or if it is localized to a specific time span.
Network utilization within the Interval Analysis is displayed to help match slow
responses with heavy network load.
• Connection Dynamics—provide a graphical view of system conversations. Packet-to-
packet delay times are shown visually, allowing instant identification of long latency
and response times. Retransmissions and lost packets are flagged in red for quick