
System information


Adding/Configuring an RMON Probe
265
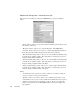
• “Vital signs report (refresh) period (10-600 sec)” textbox—allows you to define the
number of seconds between refreshing the vital signs mode.
• Connect to Probe button—allows you to connect the RMON Probe.
• Reboot Probe button—allows you to reboot the RMON Probe.
• Connection display—displays the connection status of the RMON Probe.
• “Log SNMP packets to Trace window” checkbox—when selected, logs SNMP
packets.
• “Log connection status messages” checkbox—when selected, displays any log
connection status messages.
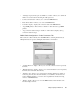
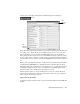
RMON Probe Configuration – Probe Parameters Tab
These items are collected directly from the RMON Probe. Selecting the interface (if
multiple interfaces are present) will display that interface’s information.
• “Software Revision” display—allows you to view the software revision reported by
the Probe.
• “Hardware Revision” display—allows you to view the hardware revision reported by
the Probe (if it is hardware-based Probe).
• “Interfaces” list—allows you to view the list of interfaces the Probe is capable of
monitoring. You may also select the interface you would like to monitor here. To
monitor multiple interfaces, you need to add a separate Probe in Observer using
Actions > Add RMON Probe.
• “ifIndex” display—allows you to view the MIB2 interface index number for the
interface being monitored.