
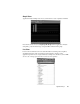
System information


194
Trending and Analysis Menu
Settings
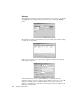
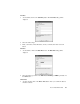
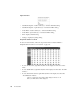
You can change the display properties of the graph (its colors, scale, etc.) by clicking
the Graph tab on the settings dialog, which you access by clicking the Settings
menu:
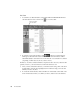
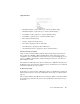
The Application Analysis setup tab lists the servers currently under analysis, letting
you add, edit, or delete them.
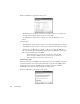
When you add or edit a server to place under Application Analysis, the following
setup dialog is displayed:
Select an IP address to monitor; Server Name lets you uniquely name this
application analysis connection. As there can be multiple connections to a given IP
address (for example, when your FTP and Telnet services reside on the same
machine), you might want to indicate the service being monitored in addition to the
DNS name of the machine.