
System information

192
Trending and Analysis Menu
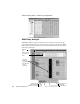
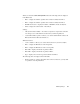
“Color” dropdown—allows you to select the color of the display item you have
selected.
Application Analysis
Menu Path
Trending/Analysis->Application Analysis
Purpose
Application Analysis lets you view detailed information about how a server is
performing, giving you an accurate picture of the user’s experience of your network
application, such as response time and failed requests. You can also configure the
analysis to track application-specific requests
Available Views
• Server Discovery
•Graph View
• List View
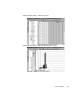
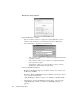
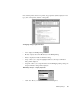
Server Discovery
Application Analysis includes a tabbed “Server Discovery” view that scans your
network and shows you active servers and any applications Observer recognizes.
Click the Server Discovery tab to display the view and click the Start button to begin
scanning.
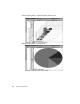
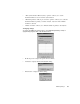
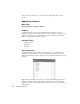
Right-click any server to add its statistics to the application analysis graph and list
displays. You can also start a packet capture on that address or create a filter. The
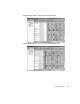
Application Analysis itself has both a graph and list view, which you can select from
the View menu.