
System information


Network Trending Mode
179
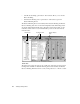
The Options Toolbar (IP Trending)
When displaying IP trending data, the Options Toolbar contains the following
buttons—in order from left to right:
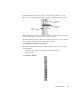
FDDI frame errors—this displays the frame errors as collected by the NDIS MAC
driver. This data is analogous to the FDDI Network Vital Signs in Observer.
When a station is selected on the calendar tree, you
will see aggregate errors by station displayed in
Observer.
Token Ring errors (by type)—displays the Token Ring errors by severity type. This
data is analogous to the Token Ring Errors by Station display in Observer.
Network Errors by Station—displays the Ethernet station errors if you are using a
supported network adapter card and driver that can report errors by station. This
data is analogous to the Network Errors by Station display in Observer.
FDDI by station—displays the FDDI station errors. This data is analogous to the
FDDI Errors by Station display in Observer.
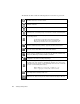
Display Properties—display properties can be set by right-clicking on the display or
by clicking the D
ISPLAY PROPERTIES button. The Display Properties dialog offers
configuration options for the components of the display, and changes depending
whether you are viewing a list or a graph.
General Viewer Properties—sets general viewer properties for the Network
Trending Viewer.
Show data per second—toggles between showing data as time-rated (per-second)
or non-time rated (generally as packets or bytes).
Show incoming packets—shows data by destination.
Show outgoing packets—shows data by source.
Show all packets—shows data by source and destination.
Show data by station—shows all data by station.