
System information


178
Trending and Analysis Menu
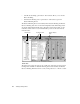
The Statistics Toolbar contains the following buttons in order from top to bottom:
Stations activity time—displays when each station was first seen on the network
and when it was last seen on the network.
Top Talkers—displays each station’s total packets in and out, and each station’s
total bytes in and out.
Packet Size Distribution—displays the packet size distribution.
Bandwidth Utilization—displays the bandwidth utilization (maximum, average, and
minimum) for the selected day or days. You must have selected “show date by time.”
Router Bandwidth Utilization—displays router bandwidth utilization in total packet
or percentage format.
You must have a router and a router speed selected in
Observer’s Router Observer mode to see statistics in this
dialog and you must have the router selected in the list.
Protocols—displays the protocols seen on the network. Available types are: TCP/IP,
IPX/SPX, NetBIOS (including NetBEUI), AppleTalk, DECNET, SNA, and Other.
TCP/IP Subprotocols—displays the subprotocols of TCP/IP seen on the network by
type. This includes ARP, RARP, IP, TCP, UDP, ICMP and Other.
IPX Subprotocols—displays the subprotocols of IPX/SPX seen on the network
broken out by type. Available types are: SPX, IPX, SAP, NCP, RIP, NetBIOS, Diagn
(Diagnostic), WatchDog, Serializ (Serialization), and Other.
IP Applications—displays configurable (port-based) IP applications. These are
configurable in the Network Trending Setup dialogs.
Errors—this display will be dependent on the topology of the trending data.
Selecting a day on the calender tree will display the aggregate errors for the entire
network based on time stamps or station (depending on the state of the “Show data
by station” or “Show data by time” buttons).
When a day is selected on the calendar tree, you
will see aggregate errors for the entire network.
Token Ring errors—displays all Token Ring soft errors. This data is similar to the
Token Ring Network Vital Signs in Observer.
Ethernet Frame errors—this displays the frame errors as collected by the NDIS
MAC driver. This data is analogous to the Ethernet Network Vital Signs in Observer.