
System information

170
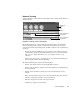
Trending and Analysis Menu
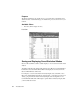
The Internet Observer Trending pane contains the following items:
• Pairs—lists the number of station pairs on the network that have exchanged IP
traffic during the present interval.
• Packets—lists the number of IP packets sent on the network during the present
interval.
• Bytes—lists the number of bytes sent in IP packets on the network during the
present interval.
• Start time—displays the start time of the present interval.
• End time—displays the end time of the present interval.
• Current time—displays the current time.
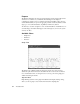
The four dial displays are:
• Packets/second (Pkt/s)—displays the packets per second rate in dial and history
(the graph below the dial) format.
• Bytes/second (B/s)—displays the bytes per second rate in dial and history (the
graph below the dial) format.
• Bandwidth Utilization (Util)—displays the currently monitored segments
bandwidth utilization in dial and history (the graph below the dial) format.
• Processor Utilization (CPU)—displays the local (or Probe) PC’s current
processor utilization in dial and history (the graph below the dial) format.
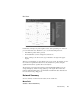
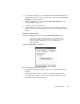
The Dashboard information pane contains the following items:
• Stations—lists the number of stations on the network that have sent traffic
during the current Network Trending session.
• Packets—lists the number of packets sent on the network during the current
Network Trending session.
• Bytes—lists the number of bytes sent on the network during the current Network
Trending session.
The dashboard is always on when the mode is displayed. The dashboard will display
information from the time Network Trending was started—it shows a continuous
display, not just of the current poll.
There are no display configuration items for the Dashboard.
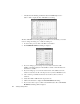
Collecting Network Trending Information
Using Network Trending mode to collect the data involves the following steps: