
System information

168
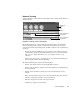
Trending and Analysis Menu
provides a more accurate statistical picture than a protocol analyzer that tries to
process all incoming data. A protocol analyzer that tries to capture all incoming data
will lose more packets during high traffic bursts and less in slower traffic periods.
Network Trending manages these enormous amounts of data in the following ways:
• First, it allows you to choose a sampling divider appropriate for your network.
An approximate rule for selection of the sampling divider for a Pentium 166
MHz PC running Observer is the maximum expected bandwidth utilization
divided by 4. This means that if the bandwidth utilization on the network often
reaches 80% (this would be quite high), you will want to use the sampling
divider 20 (or higher). You should select a still higher sampling divider on a
slower PC. Statistically speaking, a sampling divider of 10 (i.e., 1 in 10 packets
are sampled) collects plenty of data to “see” a complete picture of network traffic
over a course of hours or days. In reality, a much larger divider can be used
without the risk of erroneous results. Most modern PCs can easily handle this
sampling rate on a 100MB/sec Fast Ethernet or 16MB/sec Token Ring.
The sampling divider represents a trade-off between accuracy and speed. The
higher the sampling divider, the less data that will be collected; thus, the less
accurate the data collection. The lower the sampling factor, the slower the post-
processing of data will be, as well as the higher the likelihood of non-statistically
adjusted dropped data will affect your results.
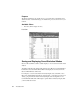
• Second, once the data is collected, the Network Trending Viewer aggregates the
data to display information in a number of convenient summation-oriented
charts, tables, or reports. The Network Trending Viewer lets you view data from
a perspective of time, and thus gives you an overview of how your network is
functioning over the course of hours, days, or weeks. This information will be
useful in a number of ways, but specifically, it allows you to see trend
information that would only be guesswork with a standard protocol analyzer’s
information. Trend data may show usage patterns that indicate the need for a
configuration change, a change in how a system is used, or that there are
infrequent, but foreseeable problems.
The Network Trending facility was integrated into Observer to provide a second
perspective to the data Observer collects. Observer’s standard modes are designed to
give you an instant snapshot of the current condition of the network. This allows you
to troubleshoot with instantaneous information. Network Trending provides a broader
view of your network and gives you overall trend information. This trend information
may be useful to solve a specific problem and can be used for long-term planning.
You can think of Network Trending as Observer information plotted against the added
dimension of time.