
System information

Network Summary
165
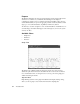
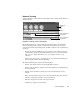
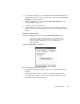
Dial View:
In Dial View, vital signs are plotted against 4 axes, each representing one of the four
protocol-defined bit rates. This allows you to see the relationships between:
• Data Packets (packets with a payload)
• Non-Data Packets (control, management, and beacon)
• Errors of all types, broken down by type in the table to the right of the graph
display.
This lets you immediately see each statistic in its proper context. For example, an error
rate of 50% is insignificant if Observer has only analyzed two packets, but quite
significant if thousands of packets have been analyzed.
The bar graphs to the right of the dial show current bandwidth utilization (U), the
average strength (S), and the average quality (Q) of the signal. These meters also
indicate (with watermark “floats”) the minimum and maximum values that Observer
has seen since the last polling period.
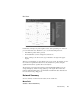
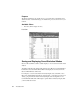
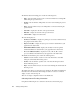
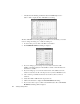
Network Summary
Shows a summary of current network activity in a browsable tree.
Menu Path
Statistics->Network Summary