
System information

164
The Statistics Menu
Purpose
The Wireless Vital Signs mode shows current wireless activity mapped with current
wireless error conditions on your WLAN. The Vital Signs mode displays a
comprehensive snapshot of error conditions and of their criticality in the context of
current WLAN activity. To pin down aggregate problems revealed by Wireless Vital
Signs, go to Access Point Statistics, Top Talkers, and Errors by Station.
Another way to use this “at-a-glance” view of network health is to install Observer on
a wireless laptop and watch what happens to the vital signs as you move the system
around your office.
Available Views
•Graph View
• Dial View:
• List View
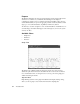
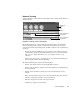
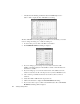
Graph View
The Graph view of Wireless Network Activity shows the error rates and other
statistics in spike meter with a user-selectable interval. You can use the scrollbar to
move “backwards in time;” hovering the cursor over any point on the graph gives
details about that point in time.
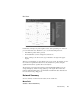
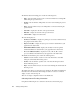
Right click Menu
Right clicking anywhere on the graph menu launches the Display Settings dialog,
where you can set graph colors, and the time interval for sampling data.