
System information

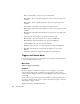

Wireless Access Point Statistics
143
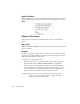
• Associations—The number of associations (connection sessions) that have been
established with this AP.
• Bytes—The total number of bytes seen.
• CRC—The total number of CRC errors reported by the AP.
• Retries—The total number of transmission retries reported by the AP.
• Station Polls—The total number of poll requests by station; a high number means
that a station cannot connect to an AP. In the 802.11b protocol, a station first polls
for an AP, then associates with a responding AP.
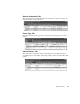
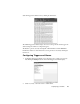
The following statistics are available on the Latest/Min/Max tab.
• Latest Strength—The strength of the signal seen at the last poll.
• Min Strength—The lowest strength signal seen, expressed as a percentage of the
optimum.
• Max Strength—The highest strength signal seen, expressed as a percentage of the
optimum.
• Latest Quality—The quality of the signal as seen at the last poll.
• Min Quality—The poorest quality signal seen, expressed as a percentage of the
optimum.
• Max Quality—The best quality signal seen, expressed as a percentage of the
optimum.
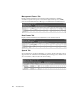
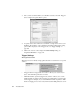
• Latest Data Rate—The data rate seen at the last poll.
• Min Data Rate—The slowest data rate seen, expressed in Mbits/sec.
• Max Data Rate—The fastest data rate seen, expressed in Mbits/sec.
• Latest Rate—The rate of total packet throughput seen at the last poll.
• Min Rate—The slowest rate of total packet throughput seen, expressed in
Mbits/sec.
• Max Rate—The fastest rate of total packet throughput seen, expressed in
Mbits/sec.
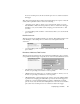
Setup and Display Properties
To change the bar height, color, and whether to display aliases or MAC addresses by
clicking the Display Properties icon to the left of the list or graph view. You can also
change the display properties for 3D charts and pie charts by clicking the Display
Properties icon to the left of the 3D Chart or Pie view.