
System information


134
The Statistics Menu
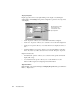
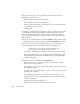
Display Properties
Display properties can be set by right-clicking on the display or by clicking the
Settings button. The Settings dialog offers configuration options for the components
of the display.
• “Item” dropdown—allows you to select which item will be configured.
• “Item color” dropdown—allows you to select the color of the main display item.
• “Item plot” dropdown—allows you to select the item to be displayed as lines or
bars.
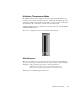
• “Item line thickness” dropdown—allows you to select the thickness of the line;
this is only active if you have selected “Lines” from the “Item plot” dropdown.
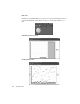
Graph horizontal scale:
• “Pixels/interval” spinbox—allows you to select how many pixels each interval
display will occupy.
• “Seconds/interval” dropdown—allows you to set the number of seconds
Observer will average before displaying interval information.
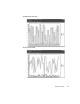
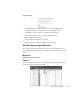
Right-Click Menu
Right-clicking on the graph will display the Display Properties dialog for Utilization
History – Graph View.
This dropdown is active
only if “Lines” was
selected in the “Item
plot” dropdown.