
System information


Utilization History Mode
133
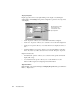
Once the Utilization History graph is displayed, it automatically begins capturing data.
The display of the data will depend on how you have setup each item in the Display
Properties dialog. There are three statistics that the display will keep track of:
maximum, average, and minimum. Although data points are only shown for the time
period set in the Display Properties dialog, data is collected and processed every
second, and then averages the data over the configured time period (seconds/interval).
Available Views
• Graph View
• Dial View
• List View
•3D Chart
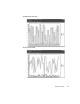
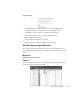
Graph View
Things to keep in mind:
• While in graph mode, it is important to remember that the scroll bar at the bottom
of the graph will allow you to see historical utilization data that was collected
during the current session of Observer.
• You can save Utilization History data to a comma-delimited file by choosing File >
Save Mode in Comma Delimited Format from Observer’s Main menu.
• The Utilization History display can be cleared using the Clear button.
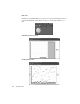
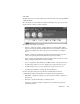
The clock
displays the
time period set
in the Display
Properties
dialog