
System information


122
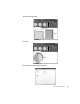
The Statistics Menu
Data:
• “Maximum items” spinbox—allows you to select the maximum items to be
displayed.
Graph:
• “3D depth” spinbox—allows you to select the 3D depth of the graph items.
• “3D angle” spinbox—allows you to select the 3D depth of the graph items.
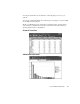
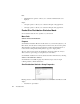
Packet Size Distribution Statistics Mode
Shows statistics about the sizes of packets on your network.
Menu Path
Statistics->Packet Size Distribution
Purpose
Size Distribution Statistics Mode shows all stations on your network (subject to your
filter criteria) and each station’s traffic patterns broken down by the size of the packet.
This information can help pinpoint network flow problems and identify stations or
routers that are sending mostly small packets as opposed to larger packets.
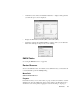
The rest of the screen shows the size distribution, divided by packet size, in bytes.
This is shown as a percentage (or total packets) for each address.
Size Distribution Statistics mode can be activated from the main window by selecting
Statistics > Size Distribution Statistics.
Size Distribution is available in graph, list, 3D chart, and pie views. To begin
collecting statistics, click the Start button.
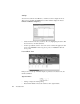
Size Distribution Statistics Setup Properties
Filtering direction—allows you to specify the direction of traffic which Observer will
display.
• “Destination” option button