
System information


Access Points Load Monitor
119
• “3D depth” spinbox—allows you to select the 3D depth of the graph items.
• “3D angle” spinbox—allows you to select the 3D depth of the graph items.
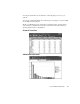
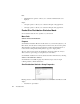
Access Points Load Monitor
Shows wireless Access Points utilization rates. Available only when the current Probe
(or Probe instance) is capturing packets from a wireless network interface. Note that for
Observer to accurately assess utilization rates, you must enter the correct bandwidth
speed (i.e., 54000000 for 801.11a/802.11g, or 11000000 for 802.11b) in the Settings
dialog.
Menu Path
Statistics->Access Points Load Monito
r
Purpose
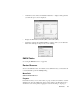
The Access Points Load Monitor lets you to look at an access point (or group of access
points) in real time to see their utilization rate. You can quickly find out if an access
point is acting as a bottleneck and, if so, whether the source of the packets clogging the
AP are incoming or outgoing (or both). By examining historical information you can
tell whether this is a chronic problem, which might indicate the need for a faster
connection, or an acute problem, which might indicate a failure of some sort. Observer
does this passively; therefore, the Access Point is not affected.
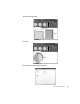
Available Views
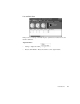
• List and Dials View
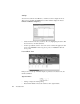
• 3D Column Chart View
•Pie View