
System information


Pair Statistics (Matrix) Mode
105
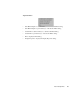
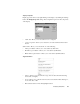
3D Chart and Pie Display Properties
Data:
• “Maximum items” spinbox—allows you to select the maximum items to be
displayed.
Graph:
• “3D depth” spinbox—allows you to select the 3D depth of the graph items.
• “3D angle” spinbox—allows you to select the 3D depth of the graph items.
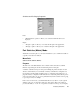
Pair Statistics (Matrix) Mode
Tracks all conversation pairs on your network and allows you to examine the details of
a specific conversation for analysis.
Menu Path
Statistics->Pairs Statistics (Matrix)
Purpose
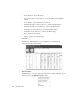
The dial mode of the Pair Statistics shows a matrix of all conversations, with line
thickness representing the amount of data flowing between each pair.
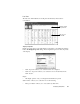
A number of statistics are kept for each pair, including the packets and bytes in each
direction, and the latency for each direction. Latency can further be configured to be
ignored after a certain number of milliseconds. see “Setup Properties (all views)” on
page 106. Latency configuration will make Observer only track packets that are part of
a true conversation flow, as opposed to packets that may be the result of someone going
to get a cup of coffee, for example.
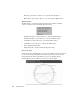
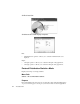
In the course of a few hours, you will find that almost every station on your segment
will have some sort of conversation with every other station. This is why Observer
provides the ability to “zoom” in on a specific conversation on the top of your display.