
System information


96
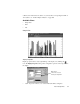
The Statistics Menu
As with the Network Activity Display, the following colors have specific meanings:
• A yellow line anywhere in the display represents an idle condition. In other
words, no matter what your display is telling you, activity is so low that the errors
are not statistically important.
• A green line shows normal network activity and error counts.
• A red line indicates error counts out of “normal” range. When a red line
condition is displayed.
A red line will be displayed when the following default error counts are
encountered:
-Utilization goes over 35%.
-CRC & packets too small represent more than 25% of the total traffic.
-Packets too big represent over 1% of total traffic.
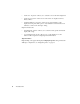
• Whenever a red line (i.e. a critical condition) is displayed, all of the formerly
green lines turn blue to highlight the network state.
You cannot start or stop this mode. When the mode is displayed, it is automatically
started. To stop the mode, simply close the mode window. The Network Vital Signs
mode can be viewed in graph, dial, or list views.
Vital Sign information can be saved to a comma delimited file by choosing
File >
Save Mode in Comma Delimited Format
.
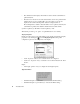
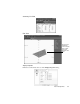
Setup Properties
Setup options are the same for graph, dial, and list views.
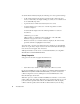
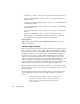
• “Run collision test” checkbox—when selected, the collision test is run.
If your network NDIS driver supports collisions (see
Options > Selected Probe or
SNMP Device Properties > Probe Parameters tab
) you can turn on Observer’s
collision testing. This is done by clicking the C
OLLISION EXPERT button on the
Network Vital Signs selection bar.
When this option is on, Observer will burst 100 Pkts/sec and listen to see how many
packets collide with other packets. This method was considered the best way to see if
your network has a problem with collisions since NDIS drivers will only display
collisions when the packet sent from the PC is collided with. If you are showing