
System information


94
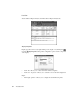
The Statistics Menu
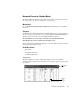
• The summation header displays the number of stations and the total number of
packets analyzed.
• The station error list box shows each station that has sent an error packet and the
number and type of errors. Additionally, error rates (value per second) are
displayed and “% Errors/Total packets” statistic is displayed. The “%
Errors/Total packets” statistic is the total number of error packets, divided by the
total number of packets times 100. In formula format it would look like:
((total error packets) / (total number of station packets)) * 100
This statistic provides a good “grade” of a particular station’s error activity.
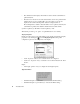
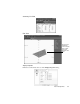
Display Properties
Display properties can be set by right-clicking on the display and selecting “Display
properties” or by clicking the icon. The Display Properties dialog offers
configuration options for the components of the display.
• “Item” dropdown—allows you to select the item to be configured.
• “Item color” dropdown—lets you select the color of the item listed in the “Item”
list box.
Graph:
• “Bar height” spinbox—lets you configure the bar height in pixels.
Right-Click Menu
• Start Packet Capture on station address(es)—activates the Filters dialog.
• Start Packet Capture on pair address(es)—activates the Filters dialog.