
Installation guide

Chapter 10
126 Sniffer Technologies
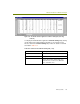
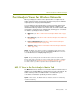
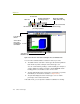
Figure 10-10. The 802.11 View in the Post-Analysis Protocol Distribution Tab
You can view accumulated data as a table, bar chart, or pie chart.
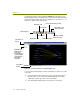
The table view lists each 802.11 frame type detected along with the
total number of packets and bytes of that frame type seen.
You can sort the table by clicking a column heading (for example, to
sort the statistics by number of packets, click the Packets column
heading). Click a second time to sort in reverse order.
The bar chart displays 802.11 frame types seen by bytes or packets
transmitted (as selected in the toolbar; see Figure 10-10).
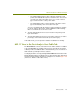
The pie chart displays the 802.11 frame types seen as relative
percentages of the total load of traffic.
In the table views, you can export the statistics for tabulation or charting.
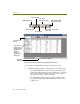
Bar chart view
Table view
Pie chart view
Display total number or
percentage of bytes
Export data to CSV format
(Table view only)
Display total number or
percentage of packets
Select 802.11 in
this list
Select Protocol
Distribution tab here
Various 802.11
frame types
listed by bytes
transmitted.
Export data to HTML
format (Table view only)