
Installation guide

Wireless Guide 125
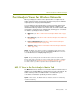
Advanced Features for Wireless Analysis
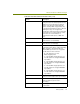
You can sort a host table by clicking a column heading (for example, to
sort the statistics by incoming packets, click the In Pkts column
heading). Click a second time to sort in reverse order.
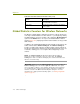
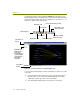
The bar chart displays the busiest wireless stations by bytes
transmitted.
The pie chart displays the busiest wireless stations as relative
percentages of the total load of traffic.
In the table views, you can export the statistics for tabulation or charting.
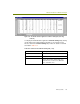
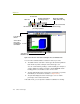
802.11 View in the Post-Analysis Protocol Distribution Tab
The Protocol Distribution tab reports network usage by protocol. In addition
to the standard views for MAC, IP, and IPX protocols, the Sniffer software
provides an additional 802.11 view that allows you to view network usage by
802.11 frame types (for example, Association Requests, Probe Requests,
Beacons, and so on).
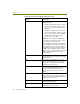
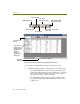
You display the 802.11 view by clicking the Protocol Dist tab at the bottom of
the Display window and then selecting the
802.11 option from the drop-down
list at the upper left of the window. The 802.11 view appears as shown in
Figure 10-10 (in this case, with the bar chart shown).