
Installation guide

Chapter 10
122 Sniffer Technologies
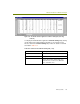
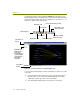
You display the 802.11 view by clicking the Matrix tab at the bottom of the
Display window and then selecting the
802.11 option from the drop-down list at
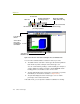
the upper left of the window. The 802.11 view appears as shown in Figure 10-8
(in this case, with the traffic map shown).
Figure 10-8. The 802.11 View in the Post-Analysis Matrix Tab
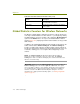
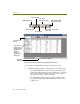
You can view accumulated 802.11 data as a traffic map, as a table, or as a bar
or pie chart.
The traffic map provides a birds-eye view of network traffic patterns
between nodes. You can filter out unwanted traffic by unchecking
certain 802.11 frame types at the left of the window.
The matrix tables display traffic count statistics for node pairs:
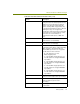
Select 802.11 in
this list
Select Matrix
tab here
Add and remove
different 802.11
frame types
from the display
by checking and
unchecking the
appropriate
boxes here.
Traffic map view
Outline table view
Detail table view
Bar chart view
Pie chart view
Define visual filter
Sort criteria (bar and pie chart)
Export data to CSV
(Table views only)
Export data to HTML
(Table views only)