
Installation guide

Chapter 10
112 Sniffer Technologies
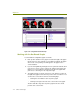
Figure 10-4. Configurable Dashboard Graph
Working with the Dashboard Graphs
You work with the configurable graphs as follows:
Each possible statistic for the graphs is listed at the right of the graph.
Check the boxes of the statistics you would like included in the graph.
A line in the corresponding color will appear in the graph for the
selected statistic.
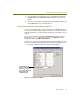
If you are having difficulty viewing the line for a particular statistic, allow
your mouse to hover over the entry for the statistic at the right of the
graph. The corresponding line will appear in bold in the graph while
your mouse is hovering over its entry at the right.
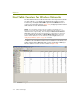
The graph includes a vertical “current” line. The statistics counters at
the right of the graph are based on the position of the “current line.” You
can move the current line in either of the following ways:
Clicking the arrow buttons at the top of the graph.
Clicking to the right or the left of the “current” line in the graph.
The time and date entry at the top of the graph shows the current
position of the “current” line.
a