
Installation guide

Wireless Guide 111
Advanced Features for Wireless Analysis
Dashboard Graphs for Wireless Networks
The Dashboard for wireless networks also provides configurable graphs for
each of the following groups of statistics:
Network statistics
Detail Errors
Statistics #1
Statistics #2
Statistics #3 is present if an 802.11 a/b/g card is used
NOTE: Each of the statistics found in these graphs can also be found in the
Detail or 802.11 tabs at the top of the Dashboard. See the previous sections
for descriptions of the various statistics.
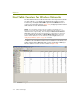
You work with the Dashboard graphs for wireless networks in the same way
you work with all Dashboard graphs — by clicking the box corresponding to the
desired group of statistics at the bottom of the Dashboard (item a, Figure 10-4).
A graph appears at the bottom of the Dashboard showing the selected
statistics.
Figure 10-4 shows a sample of the Detail Errors graph for wireless networks.
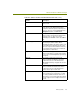
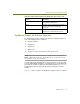
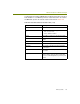
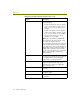
CF End/CF ACK CF End/CF ACK packets are sent to
acknowledge CF End packets.
BSSID The Basic Service Set Identification (BSSID) for
the access point on the channel being
monitored.
ESSID The Extended Service Set Identification
(ESSID) for the channel being monitored.
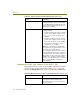
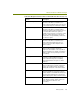
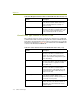
Table 10-5. Control Frame Counters in the Dashboard’s 802.11 Tab (2 of 2)
Counter Description