
Installation guide

Chapter 10
104 Sniffer Technologies
The Dashboard’s Gauge Tab
The Gauge tab is displayed by default when you start the Dashboard. You can
see the Gauge tab in Figure 10-1 on page 102.
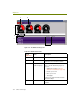
When capturing from wireless networks, the Dashboard’s Gauge tab provides
a Throughput gauge. This gauge provides a real-time measurement of the
data rate (in bits per second) observed by the Sniffer software. When
calculating throughput, the Sniffer software only counts data frames.
Management and control frames are not part of this calculation. However, the
throughput measurement does include the header portions of data frames.
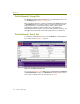
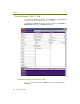
The Dashboard’s Detail Tab
To view wireless Dashboard counters, click the Detail tab on the Dashboard.
The counters shown in Figure 10-2 appear.
Figure 10-2. The Dashboard’s Detail Tab
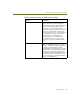
As you can see in Figure 10-2, in addition to the standard Dashboard Network
and Size Distribution counters, the Detail Errors column provides counters
for the wireless LAN-specific errors described in Table 10-2.