
User Manual Part 2


Lynx.GX Installation and Management
Viewing the RSL Log
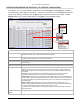
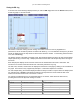
A window such as the following is displayed when you click the RSL Log button from the Status window; this is
an RSL log page at 1-minute intervals.
This feature is useful for tracking the RSL reading of the radio over time to view any degradation of
performance, and to correlate any alarms recorded in the Alarm log. You can determine the frequency at which
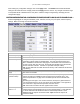
entries are displayed from the drop-down box at the bottom left of the window. To clear all log entries and start
over, click on Clear Log.
The display consists of the latest 120 sample points, with the latest sample point at the far right and the earliest
sample point moving to the left edge. Sample points older than the latest 120 samples drop off the left edge of
the screen.
Each sample point displays the min and max values from the measurement interval as a vertical bar. This
ensures that no extreme values are missed even if the same periods are very long.
The date, time, max RSL, and min RSL are displayed at the bottom of the page by clicking on the vertical bar on
the graph. This function is only supported by Netscape 7.x and Internet Explorer 5.5 and later.
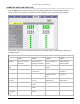
For each sample setting, the total time displayed varies but always consists of only the latest 120 sample points.
For example, when 1 minute is selected as the setting in the drop-down box at the bottom left side of the
window, the window shows the last 120 minutes or 2 hours.
For periods of troubleshooting, the recommended setting is 15 minutes, which shows the last 30 hours,
providing more than a full day’s RSL readings to review.
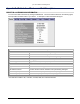
Sample Rate Total Time recorded Application
1 minute 120 minutes or 2 hours Highest resolution
15 minutes 30 hours Best for 1 day
1 hour 120 hours Best to view a workweek or long weekend
12 hours 60 days or 2 months
1 day 120 days, 4 months, or forever
Appendix B. Web Interface Windows and Field Descriptions 60