
User manual


4.2. DESIGN INSTRUMENTS 4. Sound design with AXIOM
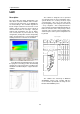
Figure 4.2: LAC Mechanical View window
is like calculating respectively for 3, 5 or 7 points within the chosen band segment.
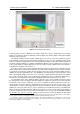
Once all the simulation parameters have been set, the calculation motor can be started by pressing
the Start button in the Simulate module. The feed bar will show the calculation phases and at the end
the direct range map for the configuration chosen will come up.
Below the colour map there is a graph showing the distr ibution of the acoustic pressure generated
by the array, which corresponds to the position of the cross pointer on the broken line. The broken line
ideally represents the position of the spectators’ heads, sitting or standing according to the selection
made in the Audience module. The same query can be made for all the defined audience areas. The
graph showing acoustic pressure related to frequency is always automatically shown, and it is continu-
ously updated any time a parameter is modified. Calculation accuracy for this graph can be set using
the preferences menu. The frequency of the calculation is set by the same command which sets the
frequency of the direct range map calculation. This pull-down menu is connected with the scroll-down
button on the mouse: you can change the frequency by highlighting the menu. This system allows the
quick scrolling of all frequencies in order to have an immediate picture of the situation.
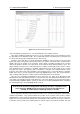
Once the most satisfying configuration has been found, you can switch to the Mechanical View
window. On the left of this window you will see a lateral view of the Line Array with the indications of the
suspended system weight and of the total dimensions of the array. Had you selected any feature that is
not mechanically compatible with the system you have chosen, it will be highlighted with a red flashing
line, indicating the type of incompatibility which occurred.
Even when the mechanical configuration indicated by the LAC is compatible, before
you suspend any AXIOM System you need to verify that all the load limits are
satisfied; for further details read through chapter 5 carefully.
On the right of the Mechanical View window you will see the vertical array flying bar and all relative
numbered perforations. The red line indicates the position of the systems centre of mass, and the
highlighted holes represent the best hoisting position suggested by the software in order to respect the
angles chosen in the Vertical View window. You can manually set the number of motors you need to use
to hoist the system as well as the coupling points, in order to respect any eventual constraint. For each
34