
Operation Manual


© proDAD GmbH
13
c) Successful analyses and profiles resulting from them will be marked as "<CAM>", less
successful ones as "<BAD>".
d) Good Profiles will be displayed with a "Total Average Error" below 0,3. Excellent profiles can
even reach values between 0,1 and 0,15.
e) Whether the profile you have generated works in practice, can be seen after the analysis.
Switch from "Calibration Grid" to "Viewer" and activate the splitscreen view "Compare View".
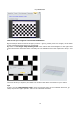
f) Select "View Source" and move the Timeline cursor manually over it or reproduce the video to
get detailled information on how your video works. Defishr shows the areas (yellow) and points.
Missing areas will be marked as described in b). Those points that were either recognized poorly
or even weren't recognized at all will be missing in the Grid histogram or will appear less marked.
Conclusion:
In case that the analysis contains
- less than 30 recognized images
- a "Total Average Error" greater than 0,3
it is advisable to repeat the analysis with optimized camera movements and plan pauses in
different camera positions. Otherweise your future corrections of unwanted Fisheye effects might
be imprecise or even wrong, in the worst case.
Here you'll find information on the import of videos.
The Analysis of your footage
First, copy the video from the camera into a directory of your video hard-disk.
Click the Import Media... option to import the video.