
User Guide


were typed, and how many results were available. It is
important that all of your customers‘ requests get a result To
improve your store be sure to add the products that meet the
customers‘ demands (searches) or add tags to your products
that are easily identifiable. For more information, see Listing
Your Product on page 24.
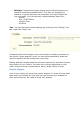
Catalog Evaluation. This section gives an overview of your
catalog‘s performance You can then know if each product is active,
or if its description is correctly entered in all of your shop‘s active
languages You can also see if all your products have enough images
their sales performance, and stock status. The overall score for each
product is displayed by a colored icon. You can define your criteria
by filling in the table at the top of the page, then clicking "Save" to
save your settings.
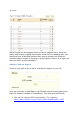
Stock Stats. This section gives you an overview of the value of
your current stock.
Stats Dashboard. This is the stats homepage. It presents a bird's
view of you store's stats.
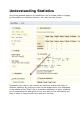
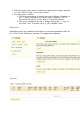
Graph Display Options
A graph can take several forms, depending on your preferences. You can
configure them in two different ways.
One: When you click a topic under the stats tab, you should see a graph.
The graph options below are shown on the left side of the page. You can
then choose the type of display. You can make a display choice that is
both aesthetically pleasing and compatible with your browser.
On each page, you will have access to the navigation sidebar of course,
but also to two settings:
Calendar. Set the time range for which you want statistics
displayed. You can either use the shortcut buttons, or enter your
own date range.