
User Guide

99
PrestaShop version 1.3 UserGuide – OCTOBER 2010
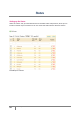
Carrier distribution. This page indicates which carriers are used most by your visitors. You can
filter all results by order status. If you learn that a carrier is not often used, despite being fast
and efficient, it might be appropriate to display it prominently during checkout, to increase
customer satisfaction.
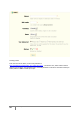
Newsletter. This page displays newsletter subscription statistics. You can use this database
keep customers informed. The newsletters usually help increase traffic to your site. If you
want to improve subscription, think about adding coupons to the newsletter. You can see all
of your subscribers’ addresses via the "Newsletter" module under the module tab.
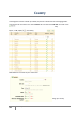
Shop search. This section presents two indicators.
The first is chart shows the distribution of keywords typed into your store’s search bad.
Therefore you can see which products your visitors desire the most.
The second is a table summarizing your visitors’ searches. You can then see what keywords
are being used, how often they were typed, and how many results were available. It is
important that all of your customers’ requests get a result. To improve your store, be sure to
add the products that meet the customers’ demands (searches), or add tags to your products
that are easily identifiable. For more information, see Listing Your Product on page 24.
Catalog Evaluation. This section gives an overview of your catalog’s performance. You can
then know if each product is active, or if its description is correctly entered in all of your
shop’s active languages. You can also see if all your products have enough images, their sales
performance, and stock status. The overall score for each product is displayed by a colored
icon. You can define your criteria by filling in the table at the top of the page, then clicking
"Save" to save your settings.
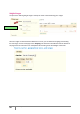
Graph Displays
A graph can take several forms. Depending on your preferences you can configure them in different
ways.
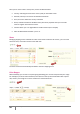
Step One: When you click a topic under the stats tab you should see a graph. The image options
below are shown on the left side of the page. You can then choose the type of display. You can make
a display choice that is both aesthetically pleasing and compatible with your browser.
• Visifire
• XML / SWF Charts
• Google Chart
• Artichow
You can also access these settings by clicking on the sub-tab "Setting" under the "Stats" tab.