
User Guide

98
PrestaShop version 1.3 UserGuide – OCTOBER 2010
o Products never bought
o Conversion rate. Indicates the relation between the number of visitors and the
number of purchases. It is important that this rate be as high as possible.
o A table at the bottom of the page tells you what products in this category have never
been bought. We suggest that you change the price, or write a more attractive
description.
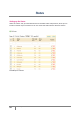
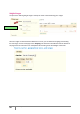
Best Customers. This section lists the best customers in your store. It displays their
coordinates, as well as the number of visits that they have made, the number of pages
consulted, and how much they spent. Keep an eye on this page in order to keep track of, and
take care of, your best customers. By clicking on the buttons on top of the columns, you can
choose how you would like to see this data.
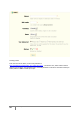
Visitors Origin. Uses a graph to give you the top ten sites and search engines that have sent
visitors to you. Generally search engines play a very important role. If you create a marketing
campaign by publishing articles on other sites, you can see what impact this had on your site.
Below the graph are the names of the sites that brought you an audience, with the number of
visitors from each on the right hand column.
Pages Not Found. This page tells you which pages of your catalog people have attempted to
access but could not find. This is useful for finding potential technical problems that may
hinder your sales.
Search Engine Keywords. This page tells you what keywords typed into a search engine
brought visitors to your online store. This lets you know which terms make your store easily
identifiable. Conversely you can see which keywords are absent from this list.
Product Details. This page shows you all the products in your shop by the reference number,
name, and stock. You can sort your results by selecting from the drop-down menu above the
product category you want to view. Click on a product to access its statistics. You can then
view a chart with two sets of data: sales made and number of visits to the product page. The
conversion rate of the product will be displayed.
Best products. This section displays your best performing products. You can now view the
turnover achieved, the average daily sales, number of page views, and the quantity left in
stock. With this table, you can identify your core products and decide whether to perform
actions such as increasing or decreasing your price or giving discounts on a specific product.
Best vouchers. This section displays the results of the coupons that you circulated through a
mail campaign or a street marketing campaign. The table will also display the turnover, and
number of coupons used.
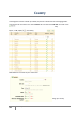
Best categories. This section presents your shop’s performance according to your categories.
You can find out how many products in each category have been sold, the revenue generated,
and number of pages viewed. Check the consistency of your results between different
categories in order to adjust your store’s cohesiveness.
Best suppliers. This section gives statistics on your suppliers by providing the quantities sold
and the revenue generated.