
User Guide

97
PrestaShop version 1.3 UserGuide – OCTOBER 2010
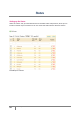
Registered Customer Info. This section is divided into 5 pie graphs.
o Gender Distribution
o Age ranges. You can learn about the distribution of your customers according to their
age. If you see that the age range of your customers is not what you imagined it
would be, think about readapting your marketing approach.
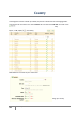
o Country distribution. You can quickly consult which countries your customers are
from.
o Currency ranges. You can see what currency is used to shop for items in your store,
and in what proportions.
o Language Distribution. You can see in what language your site is consulted most
often, and decide whether or not you should improve your site’s translations.
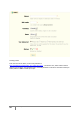
Visitors online. This section indicates the number of visitors on your site. You can see the
names of customers currently on your site and the pages that they are looking at.
Software. This section informs you of the web browsers being used to see your site. You
should verify that your site is perfectly compatible with these browsers. You can also learn if
people are using the internet on their cell phone (such as a smartphone) to access your site.
If this number is significant, you should think of having a mobile version of your store. Finally,
you can see what operating systems your visitors are using. Ensure that your site is fully
compatible with all of your visitors’ platforms.
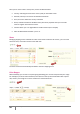
Catalog Statistics. This section contains practical information on the products sold in your
online store. The results shown here can be classified by category. You can act on your
catalog’s performance by considering the following indicators:
o Products available. Number of products proposed in this category.
o Average price (base price). Average price of the selected category.
o Product pages viewed. Number of pages looked at by your customers. Compare this
data between different categories to see which products are the most appreciated, or
on the contrary, which ones don’t attract customers. Use this information to make
some improvements in your catalog.
o Products bought. The number of products bought in each category.
o Average number of page visits
o Average number of purchases
o Images available
o Average number of images
o Products never viewed. This shows you which products, if any, do not appeal to your
customers. Or, on the contrary, if you have a nearly one to one ratio of the number of
products viewed versus the number of products made available, then your category
or your catalog is well-organized and well-managed.