
User's Manual


TES-63 Source
User manual – version 06/2021
Page 25/46
Polygon Physics SAS au capital social de 72 000 euros - 19, rue de Sassenage - 38600 Fontaine
SIREN 799 584 453 RCS Grenoble - TVA intracommunautaire FR 19 799584453 - APE 2899B
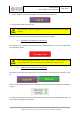
You can enter a resistance value on the “R FC” box to make the conversion on intensity (only for input
1).
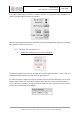
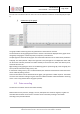
f) Parameters of the graph:
The graph enables monitoring of the key parameters of the IE-GUN in real time.
The horizontal axis of the graph gives the time in seconds. The total time displayed in the graph can be
changed by changing the number of points ("# of points") at the bottom.
The plot legend is shown left of the graph. The check boxes allow the user to select which parameters
to display. The value (default: 1.00) on the right side in the plot legend is a multiplication factor that
can be used to scale the parameter for better visibility on the vertical axis, which has arbitrary units,
and scales from 0 to 10.
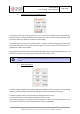
Right-clicking on the graph gives access to the following options: pause the graph, reset the graph, and
turn on/off the automatic scaling of the y-axis.
If "Automatic scaling of the y- axis" has been disabled, the minimum and maximum of the vertical axis
can be edited by clicking on them.
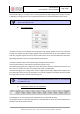
There are three buttons at the bottom left of the graph, just right of the number of points. The middle
one is the most relevant: clicking on it gives access to 6 different modes of data visualization. Zooming
on the x-axis is only possible when the graph is paused.
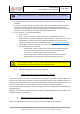
6.3 Data recording
The data are recorded on the microcontroller memory.
Relevant data such as pressure, voltages, currents, UHF power are saved into Log files, Log files are
accessible with the ethernet connector. This data can be accessed by creating a share folder
according to the procedure below: