
Data Sheet

TB67S279FTG, TB67S289FTG, TB67S249FTG Application Note
2018-03-07
20 / 33
Preliminary
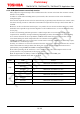
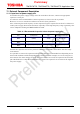
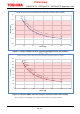
Figure 11.1
Graph of ROSC and f
OSCM
(reference data/measurement data example)
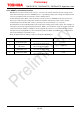
Figure 11.2
Graph of ROSC and fchop (reference data/measurement data example)
Note: Values in the graphs are reference data. They are not guaranteed.
2.63
2.37
2.23
2.08
1.80
1.67
1.55
1.34
1.15
1.07
0.98
0.83
0.70
0.58
0.0
0.5
1.0
1.5
2.0
2.5
3.0
0.0 2.0 4.0 6.0 8.0 10.0 12.0
fOSCM [MHz]
ROSC [kΩ]
Graph of ROSC and fOSCM (reference data/measurement data example)
164.38
148.13
139.38
130.00
112.50
104.38
96.88
83.75
71.88
66.88
61.25
51.88
43.75
36.25
0
20
40
60
80
100
120
140
160
180
0.0 2.0 4.0 6.0 8.0 10.0 12.0
fchop [kHz]
ROSC [kΩ]
Graph of ROSC and fchop (reference data/measurement data example)