
Data Sheet

SpO2 Sensor
Data Sheet
PLUX – Wireless Biosignals, S.A.
Av. 5 de Outubro, n. 70 – 8.
1050-059 Lisbon, Portugal
plux@plux.info
http://biosignalsplux.com/
REV A
© 2015 PLUX
This information is provided "as is," and we make no express or implied warranties whatsoever with respect to functionality, operability, use,
fitness for a particular purpose, or infringement of rights. We expressly disclaim any liability whatsoever for any direct, indirect, consequential,
incidental or special damages, including, without limitation, lost revenues, lost profits, losses resulting from business interruption or loss of data,
regardless of the form of action or legal theory under which the liability may be asserted, even if advised of the possibility of such damages.
* For additional parameters please contact plux@plux.info
SPECIFICATIONS
> Infrared emitter*
>Peak emission: 950nm
>Centroid wave: 940nm
>Spectral bandwitdth: 42nm
>Radiant intensity: 2mW/sr
> Red emitter*
>Peak emission: 660nm
>Centroid wave: 655nm
>Spectral bandwitdth: 17nm
>Radiant intensity: 2.6mW/sr
> Detector*
>Wavelength of max sensitivity: 920nm
>Range of sensitivity: 400nm-1100nm
>Radiant sensitive area: 1.3x1.3 (mm)
>Spectral sensitivity(940nm): 0.77A/W
> Infrared/Red emitter
>Duty cycle: 25%
>Min current: 0.20mA
>Max current: 50mA
> Resolution: 16bit
> Sampling frequency: 500Hz
FEATURES
> Adjustable current for each LED using the API
> Subtracts ambient light
> Pre-conditioned digital output
> High signal-to-noise ratio
> Medical-grade raw data output
> Ready-to-use form factor
APPLICATIONS
> Oximetry
> Heart rate & heart rate variability
> Life sciences studies
> Biomedical research
> Human-Computer Interaction
GENERAL DESCRIPTION
The SpO2 (peripheral capillary oxygen
saturation) sensor uses two emitting LED’s one
in the red region and the other in the infrared
region of the spectrum. The reflected light of
each one of these LED’s is absorbed by a
photodiode that converts this current into a
digital value that is sent via SPI. This sensor can
be used to estimate the oxygen saturation level
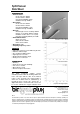
Fig. 1. Miniaturized form factor for minimally-intrusive
application on the subjects
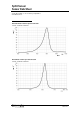
Fig. 2. Typical reflected red light raw data (acquired
with biosignalsplux).
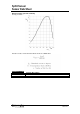
Fig. 3. Typical reflected infrared light raw data
(acquired with biosignalsplux).