
Data Sheet


biosignalsplux
User Manual
!
!
!
108!of!159!
!
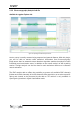
Figure 88: EMG signal processing - Collecting samples (A); Construct the amplitude histogram (B) and the cumulative
amplitude (C), which will be converted into an APDF curve. [Adapted from Jonsson (1982)].
The final results of the APDF processing allows to evaluate the relative intensity of
different tasks in a workstation as a whole or even the sequence realized for workers
during their turn.
The amplitude probability of a certain level of contraction is the muscle’s electrical
activity probability lower or equal than the level of contraction. The amplitude
probability of a certain level can be expressed as the time interval where the signal is
less or equal than that level. If the electromyographic activity amplitude is expressed in
percentage of the MVC’s calculated value, the amplitude probability distribution is
related to the contractions during the work day.
The contraction level of electromyographic signals, which has an amplitude distribution
probability that initiates at a probability P=0 level, indicates the lowest contractile
activity that occurred throughout the work period. This corresponds to the basal static of
contraction level which is, in most of the cases, zero or quite close to zero, especially in
long-term acquisitions. A typical situation of this type of contraction is the interruptions
between active periods of work.
The highest contraction level of EMG amplitude distribution probability curve
corresponds to a probability of P=1, indicating the highest level recorded over the work