
Gigabit Ethernet Switch User's Manual
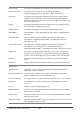

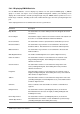

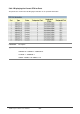
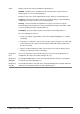
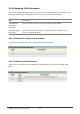
Table Of Contents
- Chapter 1. Introduction
- Chapter 2. Installing the Switch
- Chapter 3. Switch Management
- Chapter 4. Console Interface
- 4.1 Login Screen
- 4.2 Main Menu
- 4.3 System Information Menu
- 4.4 Management Setup Menu
- 4.5 Device Control Menu
- 4.5.1 Setting the System Operation Mode
- 4.5.2 Layer 2 Menu
- 4.5.3 Using the Bridge Menu
- 4.5.4 Configuring Virtual LANs
- 4.5.5 Configuring IGMP Snooping
- 4.5.6 Configuring IP Settings
- 4.5.7 Security Menu
- 4.5.8 Jumbo Packet Configuration
- 4.6 Monitoring the Switch
- 4.6.1 Displaying Port Statistics
- 4.6.2 Layer 2 Address Tables
- 4.6.3 Displaying Bridge Information
- 4.6.4 Displaying VLAN Information
- 4.6.5 IP Multicast Registration Table
- 4.6.6 IP Address Table
- 4.7 Resetting the System
- 4.8 Logging Off the System
- Chapter 5. Web Interface
- 5.1 Web-Based Configuration and Monitoring
- 5.2 Navigating the Web Browser Interface
- 5.3 Panel Display
- 5.4 Main Menu
- 5.5 System Information Menu
- 5.6 Management Setup Menu
- 5.7 Device Control Menu
- 5.7.1 Layer 2 Menu
- 5.7.2 Using the Bridge Menu
- 5.7.3 Configuring Virtual LANs
- 5.7.4 Configuring IGMP Snooping
- 5.7.5 Configuring IP Settings
- 5.7.6 Configuring Security Filters
- 5.7.7 Jumbo Packet Configuration
- 5.8 Monitoring the Switch
- 5.9 Resetting the System
- Chapter 6.Advanced Topics
- Appendix A Troubleshooting
- Appendix B Pin Assignments
- GLOSSARY

WGS3 Layer 3 Switch User’s Manual
- 205 -
5.8.1.2 Displaying RMON Statistics
Use the RMON Statistics screen to display key statistics for each port from RMON group 1. (RMON
groups 2, 3 and 9 can only be accessed using SNMP management software.) The following screen
displays the overall statistics on traffic passing through each port. RMON statistics provide access to a
broad range of statistics, including a total count of different frame types and sizes passing through each
port.
Values displayed have been accumulated since the last system reboot.
Parameter Description
Drop Events The total number of events in which packets were dropped due to lack
of resources.
Received Bytes Total number of bytes of data received on the network. This statistic can
be used as a reasonable indication of Ethernet utilization.
Received Frames The total number of frames (bad, broadcast and multicast) received.
Broadcast Frames The total number of good frames received that were directed to the
broadcast address. Note that this does not include multicast packets.
Multicast Frames The total number of good frames received that were directed to this
multicast address.
CRC/Alignment Errors The number of CRC/alignment errors (FCS or alignment errors).
Undersize Frames The total number of frames received that were less than 64 octets
long(excluding framing bits, but including FCS octets) and were
otherwise well formed.
Oversize Frames The total number of frames received that were longer than 1518
octets(excluding framing bits, but including FCS octets) and were
otherwise well formed.
Fragments The total number of frames received that were less than 64 octets in
length(excluding framing bits, but including FCS octets) and contained
either an FCS or alignment error.
Jabbers The total number of frames received that were longer than 1518 octets
(excluding framing bits, but including FCS octets), and contained either
an FCS or alignment error.
Collisions The best estimate of the total number of collisions on this Ethernet
segment.
64 Byte Frames The total number of frames (including bad packets) received and
transmitted that were 64 octets in length (excluding framing bits but
including FCS octets).
65-127 Byte Frames
128-255 Byte Frames
The total number of frames (including bad packets) received and
transmitted where the number of octets fall within the specified range
(excluding framing bits but including FCS octets).