
Gigabit Ethernet Switch User's Manual

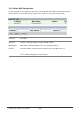

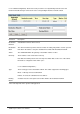
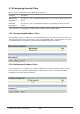
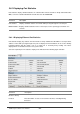
Table Of Contents
- Chapter 1. Introduction
- Chapter 2. Installing the Switch
- Chapter 3. Switch Management
- Chapter 4. Console Interface
- 4.1 Login Screen
- 4.2 Main Menu
- 4.3 System Information Menu
- 4.4 Management Setup Menu
- 4.5 Device Control Menu
- 4.5.1 Setting the System Operation Mode
- 4.5.2 Layer 2 Menu
- 4.5.3 Using the Bridge Menu
- 4.5.4 Configuring Virtual LANs
- 4.5.5 Configuring IGMP Snooping
- 4.5.6 Configuring IP Settings
- 4.5.7 Security Menu
- 4.5.8 Jumbo Packet Configuration
- 4.6 Monitoring the Switch
- 4.6.1 Displaying Port Statistics
- 4.6.2 Layer 2 Address Tables
- 4.6.3 Displaying Bridge Information
- 4.6.4 Displaying VLAN Information
- 4.6.5 IP Multicast Registration Table
- 4.6.6 IP Address Table
- 4.7 Resetting the System
- 4.8 Logging Off the System
- Chapter 5. Web Interface
- 5.1 Web-Based Configuration and Monitoring
- 5.2 Navigating the Web Browser Interface
- 5.3 Panel Display
- 5.4 Main Menu
- 5.5 System Information Menu
- 5.6 Management Setup Menu
- 5.7 Device Control Menu
- 5.7.1 Layer 2 Menu
- 5.7.2 Using the Bridge Menu
- 5.7.3 Configuring Virtual LANs
- 5.7.4 Configuring IGMP Snooping
- 5.7.5 Configuring IP Settings
- 5.7.6 Configuring Security Filters
- 5.7.7 Jumbo Packet Configuration
- 5.8 Monitoring the Switch
- 5.9 Resetting the System
- Chapter 6.Advanced Topics
- Appendix A Troubleshooting
- Appendix B Pin Assignments
- GLOSSARY
WGS3 Layer 3 Switch User’s Manual
- 202 -
5.8.1 Displaying Port Statistics
Port Statistics display standard statistics on network traffic from the Interfaces Group and Ethernet-like
MIBs, as well as a detailed breakdown of traffic based on the RMOM MIB.
Parameter Description
Port Statistics Displays standard statistics on network traffic passing through the selected port.
RMON Statistics Displays detailed statistics for the selected port, such as packet type and frame size
counters.
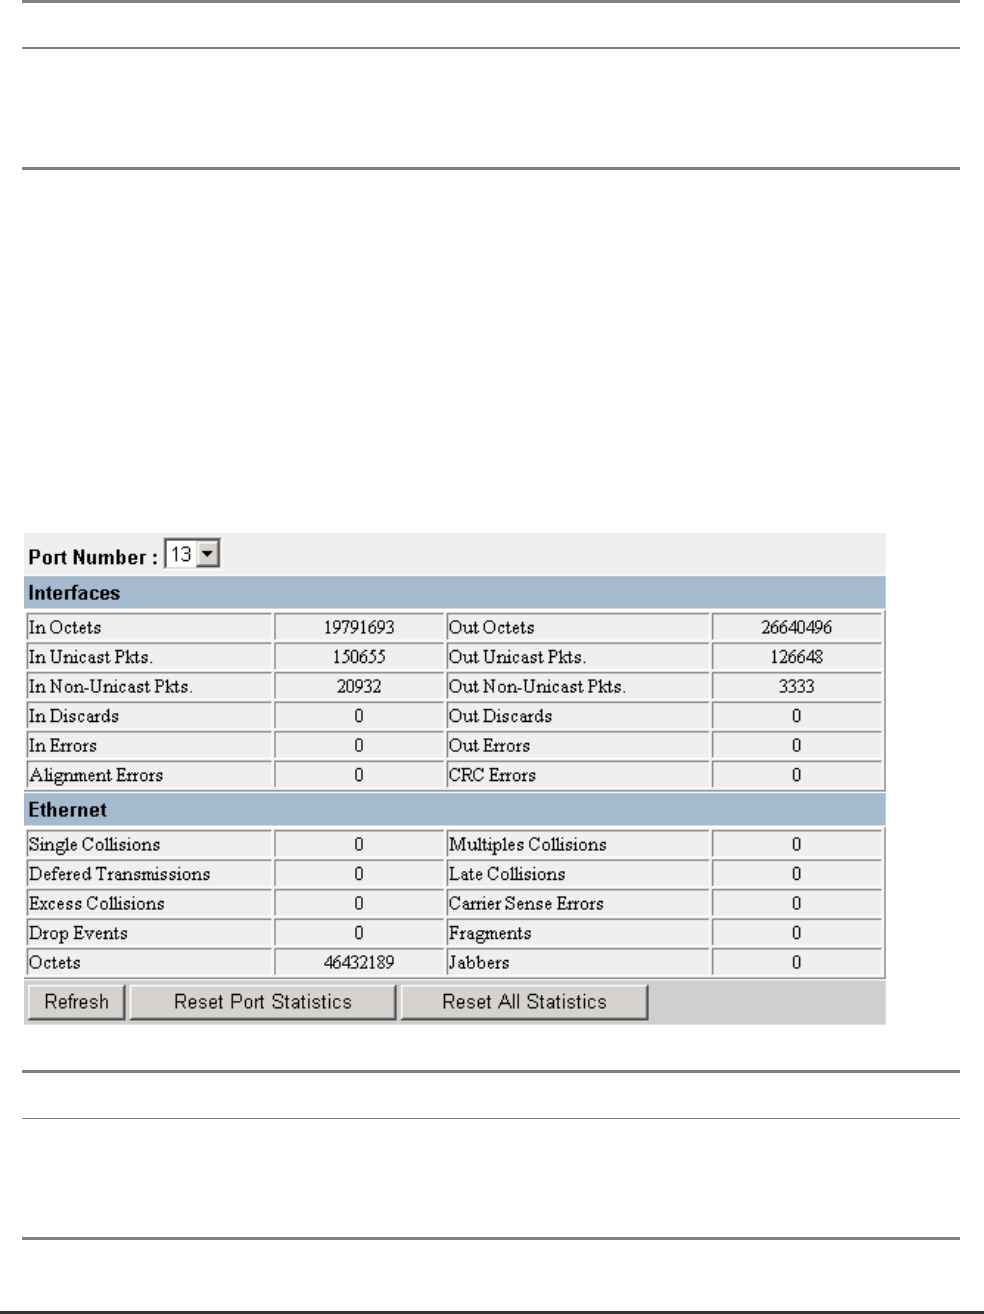
5.8.1.1 Displaying Ethernet Port Statistics
Port Statistics display key statistics from the Interfaces Group and Ethernet-like MIBs for each port. Error
statistics on the traffic passing through each port are displayed. This information can be used to identify
potential problems with the switch, such as a faulty port or unusually heavy loading. The values
displayed have accumulated since the last system reboot.
Select the required port. The statistics displayed are indicated in the following figure and table.
Parameter Description
Interfaces Group
In Octets The total number of octets received on the interface, including framing
characters.