
Gigabit Ethernet Switch User's Manual
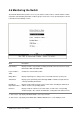
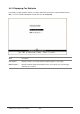
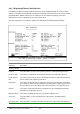
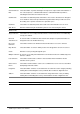
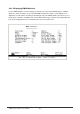
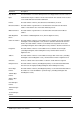
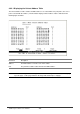
Table Of Contents
- Chapter 1. Introduction
- Chapter 2. Installing the Switch
- Chapter 3. Switch Management
- Chapter 4. Console Interface
- 4.1 Login Screen
- 4.2 Main Menu
- 4.3 System Information Menu
- 4.4 Management Setup Menu
- 4.5 Device Control Menu
- 4.5.1 Setting the System Operation Mode
- 4.5.2 Layer 2 Menu
- 4.5.3 Using the Bridge Menu
- 4.5.4 Configuring Virtual LANs
- 4.5.5 Configuring IGMP Snooping
- 4.5.6 Configuring IP Settings
- 4.5.7 Security Menu
- 4.5.8 Jumbo Packet Configuration
- 4.6 Monitoring the Switch
- 4.6.1 Displaying Port Statistics
- 4.6.2 Layer 2 Address Tables
- 4.6.3 Displaying Bridge Information
- 4.6.4 Displaying VLAN Information
- 4.6.5 IP Multicast Registration Table
- 4.6.6 IP Address Table
- 4.7 Resetting the System
- 4.8 Logging Off the System
- Chapter 5. Web Interface
- 5.1 Web-Based Configuration and Monitoring
- 5.2 Navigating the Web Browser Interface
- 5.3 Panel Display
- 5.4 Main Menu
- 5.5 System Information Menu
- 5.6 Management Setup Menu
- 5.7 Device Control Menu
- 5.7.1 Layer 2 Menu
- 5.7.2 Using the Bridge Menu
- 5.7.3 Configuring Virtual LANs
- 5.7.4 Configuring IGMP Snooping
- 5.7.5 Configuring IP Settings
- 5.7.6 Configuring Security Filters
- 5.7.7 Jumbo Packet Configuration
- 5.8 Monitoring the Switch
- 5.9 Resetting the System
- Chapter 6.Advanced Topics
- Appendix A Troubleshooting
- Appendix B Pin Assignments
- GLOSSARY
WGS3 Layer 3 Switch User’s Manual
- 97 -
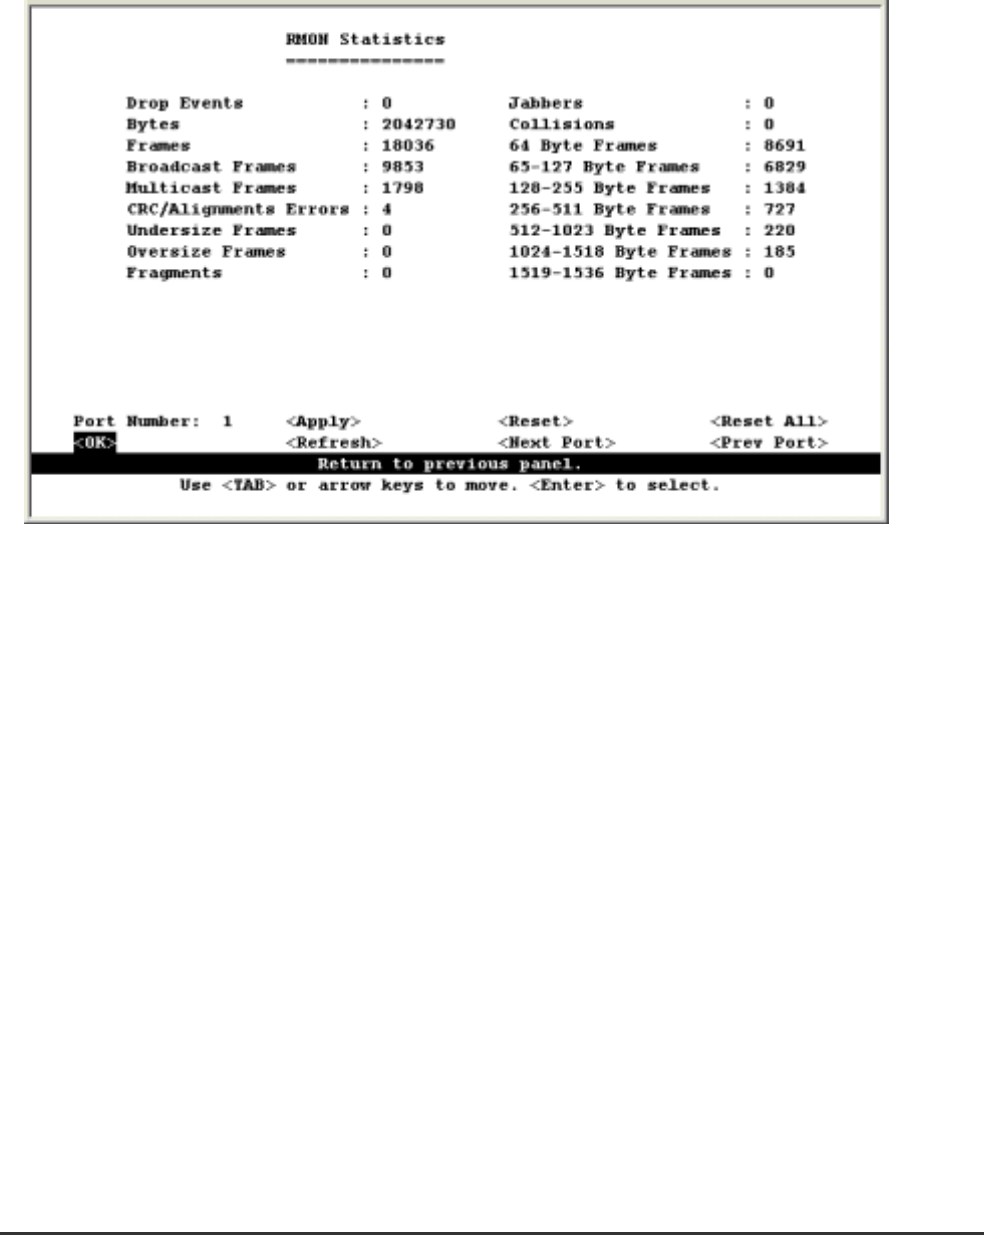
4.6.1.2 Displaying RMON Statistics
Use the RMON Statistics screen to display key statistics for each port from RMON group 1. (RMON
groups 2, 3 and 9 can only be accessed using SNMP management software.) The following screen
displays the overall statistics on traffic passing through each port. RMON statistics provide access to a
broad range of statistics, including a total count of different frame types and sizes passing through each
port. Values displayed have been accumulated since the last system reboot.