
GS-5220-Series (V4) User Manual
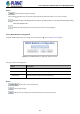

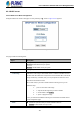
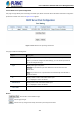
Table Of Contents
- 1. INTRODUCTION
- 2. INSTALLATION
- 3. SWITCH MANAGEMENT
- 4. WEB CONFIGURATION
- 4.1 Main Web Page
- 4.2 System
- 4.2.1 Management
- 4.2.1.1 System Information
- 4.2.1.2 IP Configuration
- 4.2.1.3 IP Status
- 4.2.1.4 Users Configuration
- 4.2.1.5 Privilege Levels
- 4.2.1.6 NTP Configuration
- 4.2.1.6.1 System Time Correction Manually
- 4.2.1.7 Time Configuration
- 4.2.1.8 UPnP
- 4.2.1.9 DHCP Relay
- 4.2.1.10 DHCP Relay Statistics
- 4.2.1.11 CPU Load
- 4.2.1.12 System Log
- 4.2.1.13 Detailed Log
- 4.2.1.14 Remote Syslog
- 4.2.1.15 SMTP Configuration
- 4.2.2 Simple Network Management Protocol
- 4.2.3 RMON
- 4.2.4 DHCP server
- 4.2.1 Management
- 4.3 Switching
- 4.3.1 Port Management
- 4.3.2 Link Aggregation
- 4.3.3 VLAN
- 4.3.3.1 VLAN Overview
- 4.3.3.2 IEEE 802.1Q VLAN
- 4.3.3.3 VLAN Port Configuration
- 4.3.3.4 VLAN Membership Status
- 4.3.3.5 VLAN Port Status
- 4.3.3.6 Private VLAN
- 4.3.3.7 Port Isolation
- 4.3.3.8 VLAN setting example:
- 4.3.3.8.1 Two Separate 802.1Q VLANs
- 4.3.3.8.2 VLAN Trunking between two 802.1Q aware switches
- 4.3.3.8.3 Port Isolate
- 4.3.3.9 MAC-based VLAN
- 4.3.3.10 Protocol-based VLAN
- 4.3.3.11 Protocol-based VLAN Membership
- 4.3.4 Spanning Tree Protocol
- 4.3.5 IGMP Snooping
- 4.3.6 MLD Snooping
- 4.3.7 MVR (Multicast VLAN Registration)
- 4.3.8 LLDP
- 4.3.9 MAC Address Table
- 4.3.10 Loop Protection
- 4.3.11 UDLD
- 4.3.12 GVRP
- 4.3.13 Link OAM
- 4.4 Routing
- 4.5 Quality of Service
- 4.6 Security
- 4.7 Power over Ethernet
- 4.8 Ring
- 4.9 ONVIF
- 4.10 Maintenance
- 5. SWITCH OPERATION
- 6. TROUBLESHOOTING
- APPENDIX A: Networking Connection
- APPENDIX B : GLOSSARY

User’s Manual of GS-5220 PoE Series Managed Switch
115
4.2.3.8 RMON Statistics Status
This page provides an overview of RMON Statistics entries. Each page shows up to 99 entries from the Statistics table, default
being 20, selected through the "entries per page" input field. When first visited, the web page will show the first 20 entries from
the beginning of the Statistics table. The first displayed will be the one with the lowest ID found in the Statistics table; screen in
Figure 4-2-3-8 appears.
Figure 4-2-3-8: RMON Statistics Status Overview Page Screenshot
The page includes the following fields:
Object Description
• ID
Indicates the index of Statistics entry.
• Data Source (ifIndex)
The port ID which wants to be monitored.
• Drop
The total number of events in which packets were dropped by the probe due to
lack of resources.
• Octets
The total number of octets of data (including those in bad packets) received on
the network.
• Pkts
The total number of packets (including bad packets, broadcast packets, and
multicast packets) received.
• Broadcast
The total number of good packets received that were directed to the broadcast
address.
• Multicast
The total number of good packets received that were directed to a multicast
address.
• CRC Errors
The total number of packets received that had a length (excluding framing bits,
but including FCS octets) of between 64 and 1518 octets.
• Undersize
The total number of packets received that were less than 64 octets.
• Oversize
The total number of packets received that were longer than 1518 octets.
• Frag.
The number of frames whose size is less than 64 octets received with invalid
CRC.
• Jabb.
The number of frames whose size is larger than 64 octets received with invalid
CRC.
• Coll.
The best estimate of the total number of collisions in this Ethernet segment.