
GS-5220-Series (V4) User Manual
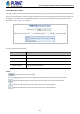
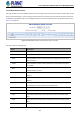

Table Of Contents
- 1. INTRODUCTION
- 2. INSTALLATION
- 3. SWITCH MANAGEMENT
- 4. WEB CONFIGURATION
- 4.1 Main Web Page
- 4.2 System
- 4.2.1 Management
- 4.2.1.1 System Information
- 4.2.1.2 IP Configuration
- 4.2.1.3 IP Status
- 4.2.1.4 Users Configuration
- 4.2.1.5 Privilege Levels
- 4.2.1.6 NTP Configuration
- 4.2.1.6.1 System Time Correction Manually
- 4.2.1.7 Time Configuration
- 4.2.1.8 UPnP
- 4.2.1.9 DHCP Relay
- 4.2.1.10 DHCP Relay Statistics
- 4.2.1.11 CPU Load
- 4.2.1.12 System Log
- 4.2.1.13 Detailed Log
- 4.2.1.14 Remote Syslog
- 4.2.1.15 SMTP Configuration
- 4.2.2 Simple Network Management Protocol
- 4.2.3 RMON
- 4.2.4 DHCP server
- 4.2.1 Management
- 4.3 Switching
- 4.3.1 Port Management
- 4.3.2 Link Aggregation
- 4.3.3 VLAN
- 4.3.3.1 VLAN Overview
- 4.3.3.2 IEEE 802.1Q VLAN
- 4.3.3.3 VLAN Port Configuration
- 4.3.3.4 VLAN Membership Status
- 4.3.3.5 VLAN Port Status
- 4.3.3.6 Private VLAN
- 4.3.3.7 Port Isolation
- 4.3.3.8 VLAN setting example:
- 4.3.3.8.1 Two Separate 802.1Q VLANs
- 4.3.3.8.2 VLAN Trunking between two 802.1Q aware switches
- 4.3.3.8.3 Port Isolate
- 4.3.3.9 MAC-based VLAN
- 4.3.3.10 Protocol-based VLAN
- 4.3.3.11 Protocol-based VLAN Membership
- 4.3.4 Spanning Tree Protocol
- 4.3.5 IGMP Snooping
- 4.3.6 MLD Snooping
- 4.3.7 MVR (Multicast VLAN Registration)
- 4.3.8 LLDP
- 4.3.9 MAC Address Table
- 4.3.10 Loop Protection
- 4.3.11 UDLD
- 4.3.12 GVRP
- 4.3.13 Link OAM
- 4.4 Routing
- 4.5 Quality of Service
- 4.6 Security
- 4.7 Power over Ethernet
- 4.8 Ring
- 4.9 ONVIF
- 4.10 Maintenance
- 5. SWITCH OPERATION
- 6. TROUBLESHOOTING
- APPENDIX A: Networking Connection
- APPENDIX B : GLOSSARY

User’s Manual of GS-5220 PoE Series Managed Switch
113
4.2.3.6 RMON History Status
This page provides an detail of RMON history entries; screen in Figure 4-2-3-6 appears.
Figure 4-2-3-6: RMON History Overview Page Screenshot
The page includes the following fields:
Object Description
• History Index Indicates the index of History control entry.
• Sample Index Indicates the index of the data entry associated with the control entry.
• Sample Start The value of sysUpTime at the start of the interval over which this sample was
measured.
• Drop The total number of events in which packets were dropped by the probe due to lack of
resources.
• Octets The total number of octets of data (including those in bad packets) received on the
network.
• Pkts The total number of packets (including bad packets, broadcast packets, and multicast
packets) received.
• Broadcast The total number of good packets received that were directed to the broadcast address.
• Multicast The total number of good packets received that were directed to a multicast address.
CRC Errors The total number of packets received that had a length (excluding framing bits, but
including FCS octets) of between 64 and 1518 octets, inclusive, but had either a bad
Frame Check Sequence (FCS) with an integral number of octets (FCS Error) or a bad
FCS with a non-integral number of octets (Alignment Error).
• Undersize The total number of packets received that were less than 64 octets.
• Oversize The total number of packets received that were longer than 1518 octets.
• Frag. The number of frames whose size is less than 64 octets received with invalid CRC.
• Jabb. The number of frames whose size is larger than 64 octets received with invalid CRC.
• Coll. The best estimate of the total number of collisions in this Ethernet segment.
• Utilization The best estimate of the mean physical layer network utilization on this interface during
this sampling interval, in hundredths of a percent.