
GS-5220-Series (V4) User Manual
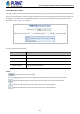
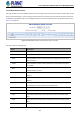

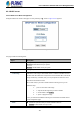
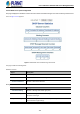
Table Of Contents
- 1. INTRODUCTION
- 2. INSTALLATION
- 3. SWITCH MANAGEMENT
- 4. WEB CONFIGURATION
- 4.1 Main Web Page
- 4.2 System
- 4.2.1 Management
- 4.2.1.1 System Information
- 4.2.1.2 IP Configuration
- 4.2.1.3 IP Status
- 4.2.1.4 Users Configuration
- 4.2.1.5 Privilege Levels
- 4.2.1.6 NTP Configuration
- 4.2.1.6.1 System Time Correction Manually
- 4.2.1.7 Time Configuration
- 4.2.1.8 UPnP
- 4.2.1.9 DHCP Relay
- 4.2.1.10 DHCP Relay Statistics
- 4.2.1.11 CPU Load
- 4.2.1.12 System Log
- 4.2.1.13 Detailed Log
- 4.2.1.14 Remote Syslog
- 4.2.1.15 SMTP Configuration
- 4.2.2 Simple Network Management Protocol
- 4.2.3 RMON
- 4.2.4 DHCP server
- 4.2.1 Management
- 4.3 Switching
- 4.3.1 Port Management
- 4.3.2 Link Aggregation
- 4.3.3 VLAN
- 4.3.3.1 VLAN Overview
- 4.3.3.2 IEEE 802.1Q VLAN
- 4.3.3.3 VLAN Port Configuration
- 4.3.3.4 VLAN Membership Status
- 4.3.3.5 VLAN Port Status
- 4.3.3.6 Private VLAN
- 4.3.3.7 Port Isolation
- 4.3.3.8 VLAN setting example:
- 4.3.3.8.1 Two Separate 802.1Q VLANs
- 4.3.3.8.2 VLAN Trunking between two 802.1Q aware switches
- 4.3.3.8.3 Port Isolate
- 4.3.3.9 MAC-based VLAN
- 4.3.3.10 Protocol-based VLAN
- 4.3.3.11 Protocol-based VLAN Membership
- 4.3.4 Spanning Tree Protocol
- 4.3.5 IGMP Snooping
- 4.3.6 MLD Snooping
- 4.3.7 MVR (Multicast VLAN Registration)
- 4.3.8 LLDP
- 4.3.9 MAC Address Table
- 4.3.10 Loop Protection
- 4.3.11 UDLD
- 4.3.12 GVRP
- 4.3.13 Link OAM
- 4.4 Routing
- 4.5 Quality of Service
- 4.6 Security
- 4.7 Power over Ethernet
- 4.8 Ring
- 4.9 ONVIF
- 4.10 Maintenance
- 5. SWITCH OPERATION
- 6. TROUBLESHOOTING
- APPENDIX A: Networking Connection
- APPENDIX B : GLOSSARY

User’s Manual of GS-5220 PoE Series Managed Switch
111
4.2.3.4 RMON Event Status
This page provides an overview of RMON Event table entries. Each page shows up to 99 entries from the Event table, default
being 20, selected through the "entries per page" input field. When first visited, the web page will show the first 20 entries from
the beginning of the Event table. The first displayed will be the one with the lowest Event Index and Log Index found in the
Event table; screen in Figure 4-2-3-4 appears.
Figure 4-2-3-4: RMON Event Overview Page Screenshot
The page includes the following fields:
Object Description
• Event Index
Indicates the index of the event entry.
• Log Index
Indicates the index of the log entry.
• Logtime
Indicates Event log time.
• Log Description
Indicates the Event description.
Buttons
: Click to refresh the page immediately.
Auto-refresh : Check this box to refresh the page automatically. Automatic refresh occurs every 3 seconds.
: Updates the table starting from the first entry in the Alarm Table, i.e. the entry with the lowest ID.
: Updates the table, starting with the entry after the last entry currently displayed.
: Updates the table, starting with the entry after the last entry currently displayed.