
Datasheet


PicoScope 4824 8 Channel Oscilloscope
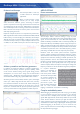
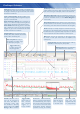
Color persistence modes
Advanced display modes allow you to see old and new data
superimposed, with new data in a brighter color or shade. This
makes it easy to see glitches and dropouts and to estimate their
relative frequency. Choose between analog persistence, digital
color, or custom display modes.
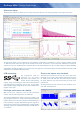
Spectrum analyzer
With the click of a button, you can open a new window to display a
spectrum plot of selected channels up to the full bandwidth of the
oscilloscope. A comprehensive range of settings gives you control
over the number of spectrum bands, window types and display
modes.
A comprehensive set of automatic frequency-domain measurements
can be added to the display, including THD, THD+N, SINAD, SNR
and IMD. You can even use the AWG and spectrum mode together
to perform swept scalar network analysis.
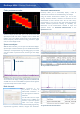
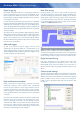
Math channels
With PicoScope 6 you
can perform a variety of
mathematical calculations on
your input signals and reference
waveforms.
Use the built-in list for simple
functions such as addition and
inversion, or open the equation
editor and create complex
functions involving trigonometry,
exponentials, logarithms, statistics, integrals and derivatives.
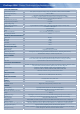
Automatic measurements
PicoScope allows you to automatically display a table of
calculated measurements for troubleshooting and analysis.
Using the built-in measurement statistics you can see the
average, standard deviation, maximum and minimum of each
measurement as well as the live value. You can add as many
measurements as you need on each view. Each measurement
includes statistical parameters showing its variability. For
information on the measurements available in scope and
spectrum modes, see Automatic Measurements in the
Specifications table.
15 scope mode measurements
11 spectrum mode measurements
> 60 dB SFDR