
Datasheet
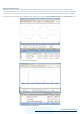
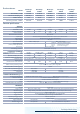
High signal integrity
Most oscilloscopes are built down to a price. PicoScopes are built up to a specification.
Careful front-end design and shielding reduces noise, crosstalk and harmonic distortion. Decades of oscilloscope design experience can be
seen in improved pulse response and bandwidth flatness. We are proud of the dynamic performance of our products and publish these
specifications in detail. The result is simple: when you probe a circuit, you can trust in the waveform you see on the screen.
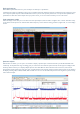
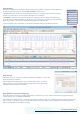
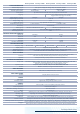
Color persistence modes
Advanced display modes allow you to see old and new data superimposed, with new data in a brighter color or shade. This makes it easy
to see glitches and dropouts and to estimate their relative frequency. Choose between analog persistence, digital color, or custom display
modes.
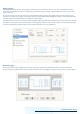
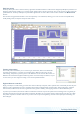
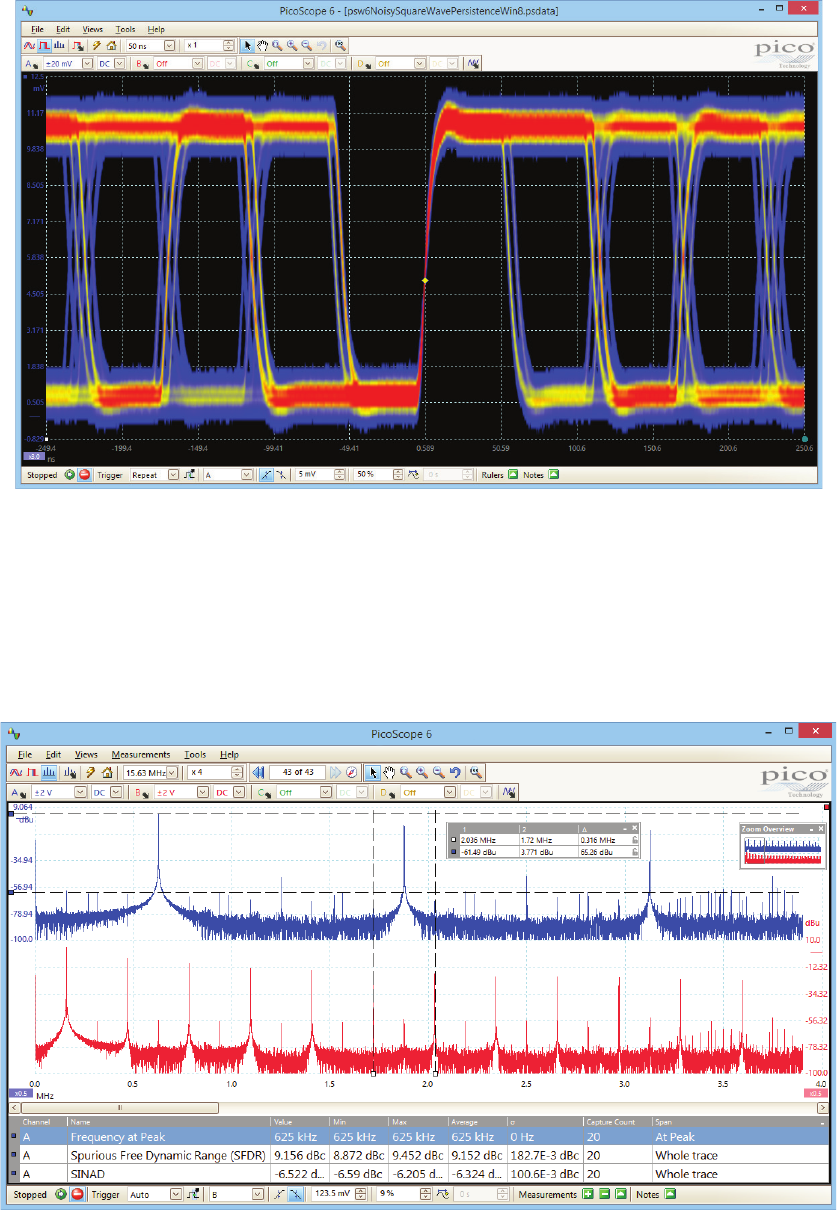
Spectrum analyzer
With the click of a button, you can open a new window to display a spectrum plot of selected channels up to the full bandwidth of the
oscilloscope. A comprehensive range of settings gives you control over the number of spectrum bands, window types and display modes.
PicoScope software allows you to display multiple spectrum views with different channel selections and zoom factors, and see these
alongside time-domain waveforms of the same data. A comprehensive set of automatic frequency-domain measurements can be added to
the display, including THD, THD+N, SINAD, SNR and IMD. You can even use the AWG and spectrum mode together to perform swept
scalar network analysis.