
Datasheet
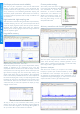

Color persistence modes
See old and new data superimposed, with new data in a brighter
color or shade. This makes it easy to see glitches and dropouts
and to estimate their relative frequency. Choose between analog
persistence, digital color or custom display modes.
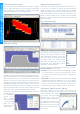
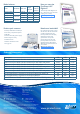
Mask limit testing
This feature is designed for production and debugging environments.
Capture a signal from a known working system, and PicoScope will
draw a mask around it with your specified vertical and horizontal
tolerances. Connect the system under test, and PicoScope will
highlight any parts of the waveform that fall outside the mask area.
The highlighted details persist on the display, so the scope can
catch intermittent glitches even while your attention is elsewhere.
The measurements window counts the number of failures, and can
display other measurements and statistics at the same time.
The numerical and graphical mask editors (both shown below) can
be used separately
or in combination,
allowing you to
enter accurate
mask specifications
or modify existing
masks. You can
import and export
masks as files.
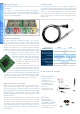
PicoScope 6000 Series PC Oscilloscopes
High-speed data acquisition
The drivers and software development kit supplied allow you
to write your own software or interface to popular third-party
software packages. If the 2 GS buffer memory of the PicoScope
6404D isn’t enough, the drivers support data streaming, a mode
that captures gap-free continuous data over the USB 3.0 port
directly to the PC’s RAM at over 150 MS/s and to solid-state
disk at up to 78 MS/s. Rates are subject to PC specifications and
application loading.
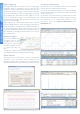
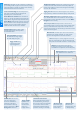
Serial data decoding
The PicoScope 6000 Series oscilloscopes are
well-suited to serial decoding, with a deep
memory buffer that allows them to collect
long, uninterrupted sequences of data. This
allows the capture of thousands of frames
or packets of data over several seconds.
The scopes can decode up to four buses
simultaneously with independent protocol
selection for each input channel.
PicoScope displays the decoded data in the format of your choice:
in view, in window, or both at once.
• In view format shows the decoded data beneath the waveform
on a common time axis, with error frames marked in red. You
can zoom in on these frames to look for noise or distortion on
the waveform.
• In window format shows a list of the decoded frames, including
the data and all flags and identifiers. You can set up filtering
conditions to display only the frames you are interested in,
search for frames with specified properties, or define a start
pattern that the program will wait for before it lists the data.
Analog and digital low-pass filtering
Each input channel has its own digital low-pass filter with
independently adjustable cut-off frequency from 1 Hz to the full
scope bandwidth. This enables
you to reject noise on selected
channels while viewing high-
bandwidth signals on the others.
An additional selectable analog
bandwidth limiter on each input
channel can be used to reject high
frequencies that would otherwise
cause aliasing.
Serial protocols
UART (RS-232)
SPI
I
2
C
I
2
S
CAN
LIN
FlexRay